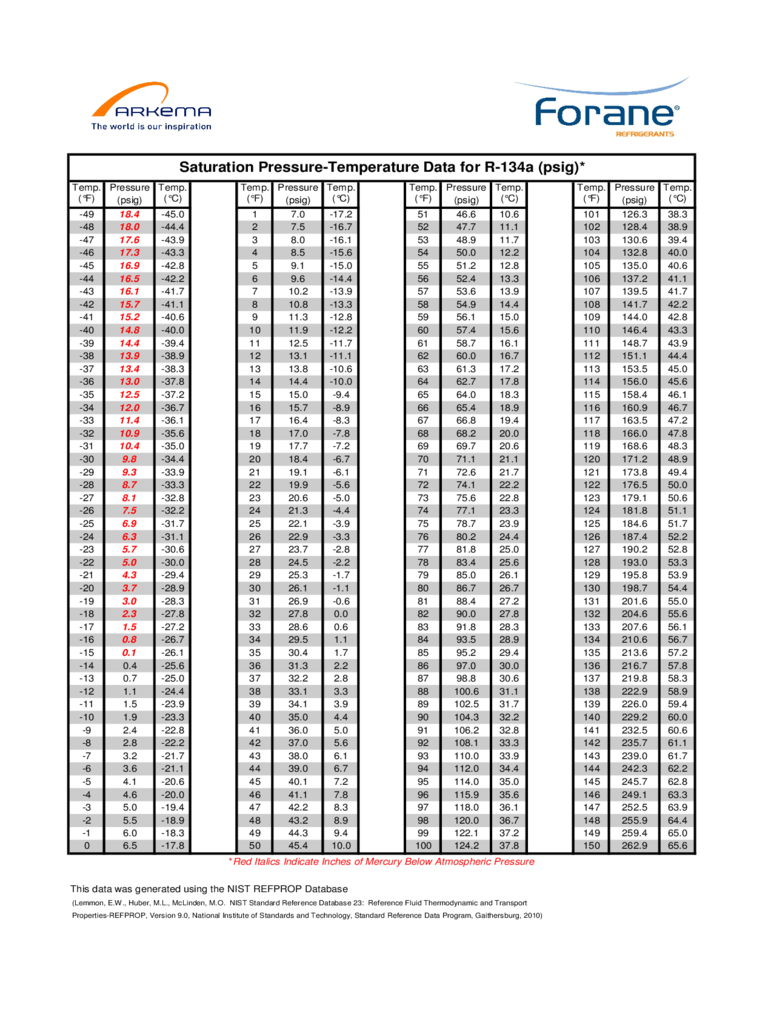
In the world of refrigeration and air conditioning, understanding the intricacies of refrigerants is paramount. Among the most prevalent refrigerants used today is R134a, known for its efficiency and relatively low environmental impact compared to older refrigerants like R12. Whether you are a seasoned technician or a curious enthusiast, grasping the fundamentals of R134a and its associated temperature-pressure chart can transform your approach to HVAC systems.
The R134a refrigerant, or tetrafluoroethane, was introduced as a replacement for R12 in the 1990s. Its lower ozone-depleting potential makes it a more environmentally favorable choice. R134a has become ubiquitous in automotive air conditioning, domestic refrigerators, and commercial cooling applications. However, the user must also comprehend how this refrigerant behaves under varying pressures and temperatures to ensure optimal performance and system longevity.
Imagine opening your car’s hood or checking your home’s air conditioning unit. You might spot a pressure gauge—this simple tool illuminates the often-misunderstood relationship between temperature and pressure. This is where the temperature-pressure chart comes into play. This chart facilitates an understanding of R134a’s behavior under different operational conditions, guiding maintenance and troubleshooting efforts.
The temperature-pressure chart for R134a provides a visual representation of how this refrigerant behaves in response to temperature changes. As the temperature of R134a increases, so does its pressure. Conversely, a decrease in temperature results in lower pressure. This relationship is crucial in various scenarios, such as diagnosing performance issues or ensuring the system is adequately charged with refrigerant.
To dive deeper, let us consider a common scenario: the air conditioning system in an automobile. When the system is engaged, the refrigerant absorbs heat from the cabin and travels to the compressor, transitioning from a low-pressure gas to a high-pressure gas. The temperature-pressure chart helps technicians identify the expected pressure readings at specific temperatures, making it possible to assess if the system is functioning within normal parameters.
For instance, at 32°F (0°C), the pressure for R134a should be around 36 psi on the low side. Understanding these benchmarks allows technicians to pinpoint issues, such as leaks or insufficient refrigerant levels. If the gauge reads significantly lower than expected, it signals a problem, prompting further investigation into the system’s integrity.
Furthermore, it is essential to recognize the differences between the low-side and high-side pressures as indicated in the chart. The low-side pressure represents the conditions under which the refrigerant absorbs heat, transitioning from liquid to gas, while the high-side pressure reflects the compression and heat rejection process. Each side serves a unique function, and keeping both within their optimal ranges ensures the system operates efficiently.
Now, consider the ramifications of not adhering to the temperature-pressure relationships delineated on the chart. Overcharging or undercharging the system can lead to a cascade of problems. An overcharged system might result in excessively high pressures, which can damage compressor seals and lead to catastrophic system failures. Conversely, an undercharged system may manifest lackluster cooling performance, forcing the compressor to work harder and ultimately shortening its lifespan.
As energy efficiency becomes key in our modern era, understanding R134a’s behavior under various conditions equips individuals and technicians to make informed decisions regarding maintenance and repairs. Tools like the R134a temperature-pressure chart not only serve as a guide but also transform the way one approaches air conditioning systems, making troubleshooting more intuitive and efficient.
Envision a situation where an HVAC technician responds to a call from an exasperated homeowner. The air conditioning unit is blowing warm air despite the thermostat reading a comfortable setting. Instead of hastily jumping to conclusions, the technician consults the temperature-pressure chart, checking the readings against the current outdoor temperature.
This methodical approach allows for a nuanced understanding of the root cause of the problem. Is it a simple refrigerant leak? Or perhaps a faulty expansion valve? The temperature-pressure chart acts as a key, unlocking solutions by guiding the technician through a series of logical deductions based on tangible data.
Moreover, as we pivot towards a more sustainable future, it’s vital to consider the potential of R134a as a transitional refrigerant. Though it is efficient, it still possesses a global warming potential that raises eyebrows among environmentalists. With growing interest in alternatives, such as CO2 or hydrofluoroolefins (HFOs), the reliance on and understanding of R134a becomes even more essential in ensuring a smooth transition to more eco-friendly refrigerants.
In conclusion, the R134a refrigerant and its temperature-pressure chart form the bedrock of informed HVAC practices. Now armed with knowledge about this vital tool and the principles behind it, you might find yourself looking at air conditioning units and refrigeration systems through a new lens. This journey of discovery, bolstered by curiosity and an understanding of refrigerants, promises a paradigm shift in how we engage with climate control systems, making each interaction calculated and effective.
Ultimately, grasping the intricacies of the R134a temperature-pressure chart leads to better maintenance practices and an appreciation for the chemistry underpinning our everyday cooling systems. The next time you check your vehicle’s AC or your home’s refrigeration unit, let the temperature-pressure chart guide you—it just might unlock a newfound expertise that transforms your understanding of modern refrigeration technology.
