Statistical testing forms the backbone of empirical research, guiding decisions across myriad fields such as medicine, social sciences, and market research. But here’s a question for you: Have you ever wondered why we conduct significance tests in the first place? And what exactly do we mean when we assert that “the alternative hypothesis is true”? This article ventures into the intricacies of statistical testing, unraveling the essential concepts that underpin hypothesis testing, particularly focusing on the significance test.
At the heart of statistical testing lies the concept of hypotheses—specifically, the null hypothesis and the alternative hypothesis. The null hypothesis (denoted as H0) serves as the default assumption that there is no effect or no difference between groups. Essentially, it posits that any observed deviation in our data could very well be due to random chance. In stark contrast, the alternative hypothesis (Ha) proposes that a genuine effect or difference exists. Understanding this dichotomy is essential as it sets the stage for conducting significance tests.
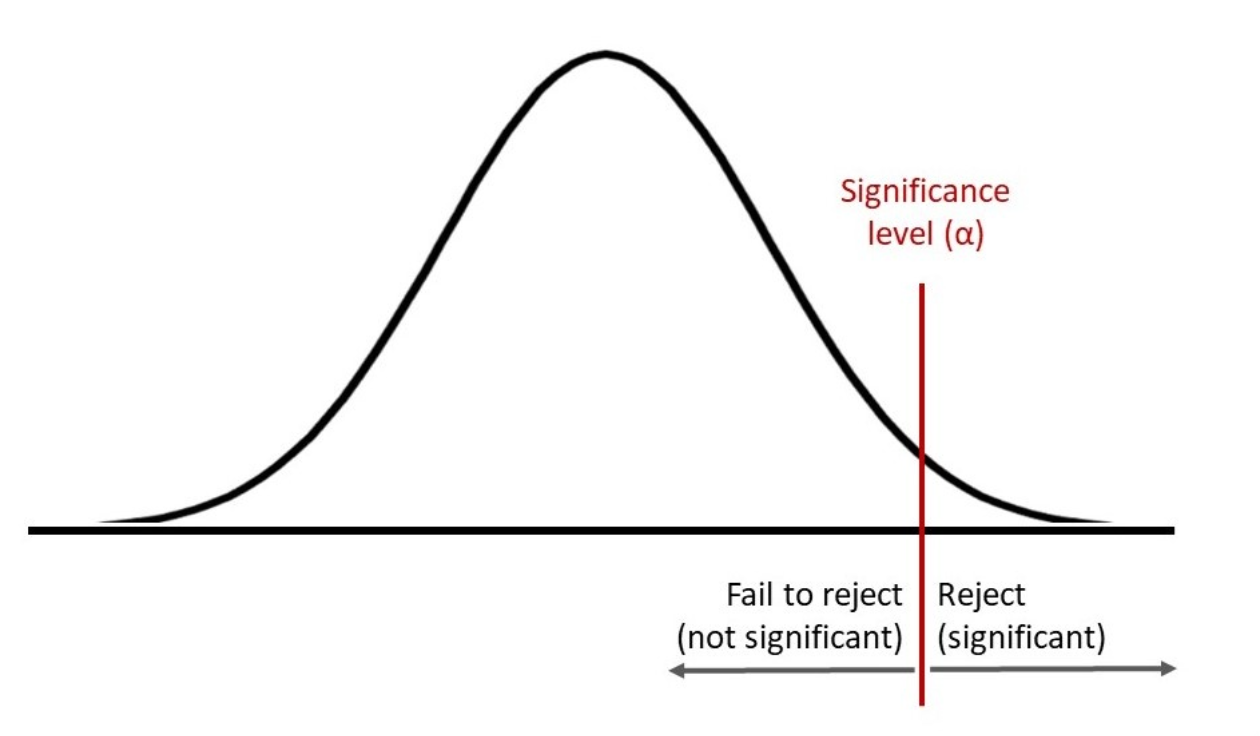
In conducting a significance test, we utilize a sample drawn from the population of interest. The results derived from this sample offer insights into whether we can reject the null hypothesis in favor of the alternative hypothesis. A critical aspect of this process is the p-value, a statistical metric that quantifies the probability of obtaining test results at least as extreme as the observed results, assuming the null hypothesis is true. When the p-value falls below a predetermined threshold known as the significance level (commonly set at 0.05), researchers often interpret this as compelling evidence against the null hypothesis.
Up to this point, you might be wondering: What if the p-value is not significant? Well, this leads us to consider Type I and Type II errors. A Type I error occurs when we mistakenly reject the null hypothesis when it is, in fact, true—a false positive scenario. Conversely, a Type II error happens when we fail to reject the null hypothesis when the alternative hypothesis is true—a false negative situation. Striking the right balance between these two types of errors can be quite the conundrum, and it often challenges researchers to carefully ponder the consequences of their testing protocols.
Let’s delve deeper into the concept of the significance level. The significance level, denoted by alpha (α), is the threshold we set before conducting our test. Setting α at 0.05, for instance, indicates that we are willing to accept a 5% chance of making a Type I error. However, the arbitrary nature of selecting this threshold can sometimes elicit debate among statisticians. Some advocate for a more stringent alpha level in high-stakes research, while others argue that context should dictate our choice. It’s a blend of science and art!
As we traverse this nuanced landscape, the concept of power also emerges as a pivotal player. Statistical power is the probability of correctly rejecting the null hypothesis when the alternative hypothesis is indeed true. This is influenced by several factors, including sample size, effect size, and the significance level. Generally, larger sample sizes and larger effect sizes lead to higher power, making it increasingly likely to detect an actual effect if one exists. Paying attention to power when designing experiments is essential, as it equips researchers with the assurance that their studies can capture genuine effects amidst the noise of data variability.
Now, let’s address how to interpret outcomes once we’ve performed a significance test. A significant result (typically p < 0.05) suggests that we have sufficient evidence to reject the null hypothesis. However, a significant result does not equate to practical significance; this distinction is paramount. A statistically significant outcome might have minimal practical implications, particularly when it comes to small effect sizes. Thus, it’s vital to evaluate the effect size alongside p-values in order to gauge the real-world impact of the findings.
It’s beneficial to appreciate the limitations of significance testing. Sole reliance on p-values can lead researchers astray, sometimes overshadowing larger, more meaningful narratives encapsulated within the data. The emphasis on a binary interpretation of “significant” or “not significant” can mislead audiences, inciting the danger of reductive reasoning. Researchers are encouraged to put significance testing into context, offering descriptive statistics, confidence intervals, and a robust narrative that enriches their conclusions.
Lastly, the proliferation of p-hacking—where researchers manipulate data or testing procedures to achieve significant results—is an insidious issue. Always strive for transparency in your methodologies, and be committed to revising hypotheses when a lack of evidence arises. The scientific community prospers through collaboration, trust, and shared standards, which ultimately leads to quality scholarship that stands the test of scrutiny.
In conclusion, engaging with statistical significance tests reveals a world rich in complexity and nuance. By understanding the interplay between the null and alternative hypotheses, p-values, and the limitations of our testing methods, we empower ourselves to draw more informed conclusions. So the next time you embark on a research endeavor, ask yourself not just about the significance of your results but also about the larger story they tell. In the grand tapestry of data, every thread counts!
